Platform Activity reports give you a real-time picture of how your organization uses Immersive Labs. You can see who's active, what they're completing, and where you need to focus.
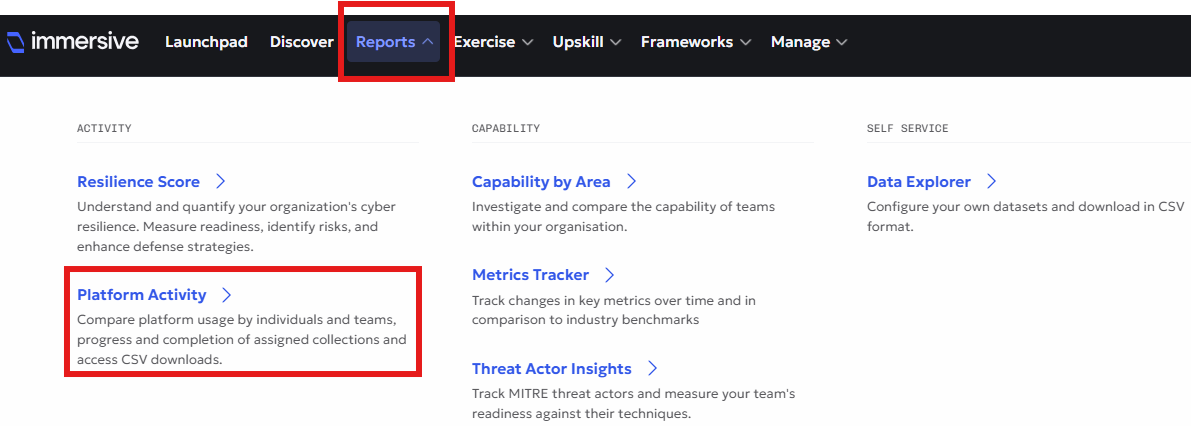
You'll find Platform Activity reports under Reports in the main navigation menu.
What you can see
Platform Activity reports let you:
- Track user engagement across the organization
- Monitor assigned content progress
- Compare team performance
- Drill into individual activity
- Identify users who need support
Note: You'll only see data for teams and users you have permission to view. Organization Managers see everything. Team Admins see their teams only.
Dashboard tabs
Platform Activity has six tabs:
- Overview – High-level snapshot
- Platform Usage – Who's using the platform and how
- Assigned Activity – Progress on collections and career paths
- Team Overview – Compare teams side-by-side
- Team Comparison – Visualize team allocation and engagement
- Individual – Drill into specific user activity
Overview
Get a snapshot of key metrics across your organization.
What's included
- User activity and engagement
- Labs completed by difficulty and area
- Assigned content status
- Crisis Sim and Workforce data (if licensed)
Available filters
- Team name
- License type
- Has current license (Y/N)
Key data points
| Metric | What it shows | How it's calculated |
|---|---|---|
| User activity | A breakdown of when users most recently used the platform (last 7 days, last 8-30 days, more than 30 days ago) | Count of users in a time period |
| Users not active for over 30 days | Percentage of registered users who haven't logged in for 30+ days | Inactive users ÷ registered users |
| Managers not active for over 30 days | Percentage of managers who haven't logged in for 30+ days | Inactive managers ÷ total managers |
| Highest difficulty level achieved | Percentage split of completions by difficulty | Completions at each difficulty (1-9 scale) |
| Completions by area | Total lab completions by category | Count by content area for date range |
| Users with assigned content not started | Users who haven't launched any assigned labs | Users assigned content with zero starts |
| Users without content assigned | Users with no current assignments | Count of users with no assigned content |
| Last Crisis Sim exercise | Date of user's last Crisis Sim | Most recent completion date |
| Exercises in last 12 months (Crisis Sim) | Total Crisis Sim completions | Count over 12 months |
When to use Overview
Use this dashboard to:
- Report high-level capability metrics
- Spot areas needing deeper investigation
- Get a quick health check
Platform Usage
See who's engaging with the platform and how they're using it.
What's included
- License usage
- Orientation completion
- User engagement by role
- Weekly lab activity
- Activity by product area
- Lab engagement by category
- User list
- Hours spent learning
- Crisis Sim, Workforce, and technical exercise data (if licensed)
Available filters
- Team name
- License type
- Date range
- Has current license (Y/N)
Key data points
| Metric | What it shows | How it's calculated |
|---|---|---|
| Licensed users | Total licenses in use | Count of active licenses |
| Users completed orientation | Percentage who finished onboarding | Users who completed setup ÷ licensed users |
| Inactive users | Percentage not logged in during date range | Inactive users ÷ total users |
| Inactive managers | Percentage of managers not logged in | Inactive managers ÷ total managers |
| Weekly lab activity | Users engaging with labs each week | Split by: attempting, completing, or just logged in |
| User logged in by type | Login percentage by system role | Logins by role vs time period |
| Types of activity | Activity split by product type | Percentage by content/product area |
| At least one lab attempted | Users who attempted any lab | Count for date range vs previous period |
| Average hours per lab per user | Mean time in labs | Total hours ÷ users who started labs |
| Lab completion by area | Percentage split by category | Activity by content category |
| Average time in labs | Usage split by working hours | In-hours (9am-5pm) vs out-of-hours |
| Monthly time in labs | Visualization of in/out-of-hours time | Bar chart by month |
| Crisis Sim participants | Participants across all exercises | Count vs previous period |
| User list | Table of users with activity details | Products used, career paths, last login, time spent |
Note on working hours: The platform uses 9am-5pm in each user's timezone.
When to use Platform Usage
Use this dashboard to:
- Monitor platform adoption
- Identify inactive users
- See which teams engage most
- Track activity patterns (in-hours vs out-of-hours)
- Encourage better platform use
Assigned Activity
Track how users progress through assigned collections and career paths.
What's included
- Assignment status (not started, in progress, completed, overdue)
- Assigned activity over time
- Top 10 users with overdue content
- Progress by collection/career path
- Progress by team
- Progress by user
Available filters
- Team name
- Content name
- Content type
- Assignment Title
- License type
- Manager assigned (Y/N)
- Selected date range
- Has current license (Y/N)
Key data points
| Metric | What it shows | How it's calculated |
|---|---|---|
| In progress | Assigned collections started but not finished | Count of started, incomplete assignments |
| Completed | Assigned collections finished | Count of completed assignments |
| Not started | Assigned collections not yet begun | Count of assignments with no activity |
| Overdue | Assignments past due date | Count of incomplete past due date |
| Cumulative outstanding and complete | Total over time | Running total of assigned vs completed |
| Top 10 users with overdue assigned content | Users with most overdue items | Top 10 by overdue count |
| Progress by content | Percentage of labs completed per assignment | Labs completed ÷ labs in assignment |
| Progress by team | Team completion percentage and time spent | By team, with hours spent |
| Progress by user | User completion percentage and time spent | By user, with hours spent |
When to use Assigned Activity
Use this dashboard to:
- Address skill gaps
- Identify users falling behind
- Monitor assignment completion rates
- Follow up on overdue content
- Track training program progress
Team Overview
Compare team performance side-by-side with detailed metrics.
What's included
A table showing:
- Percentage of active users
- Average completions per user
- Assigned content progress
You can export the table to CSV and drill into each team for more details.
Available filters
- Team name
- License type (product areas)
- Content name (collection or career path)
- Date range
- Has current license (Y/N)
- Manager assigned (Y/N)
Key data points
All calculations use the date range you select.
| Metric | What it shows | How it's calculated |
|---|---|---|
| Active users (%) | Percentage of team who logged in | Users logged in ÷ total team users |
| Number of users | Total licensed users on team | Count of licensed users |
| Users attempting labs (%) | Percentage who attempted at least one lab | Users with attempts ÷ total team users |
| Users completing labs (%) | Percentage who completed at least one lab | Users with completions ÷ total team users |
| Average hours in labs per user | Median time spent in labs | Median active time across team |
| Users with 0 completions (%) | Percentage with no completions | Users with zero completions ÷ total users |
| Average completions per user | Median completions per user | Median completion count |
| Number of completions | Total completions for team | Count of all completions |
| Attempts completed (%) | Percentage of attempts that finished | Completions ÷ total attempts |
| Average accuracy (%) | Mean accuracy across team | Mean accuracy per user, averaged |
| Average difficulty | Mean difficulty of completed labs | Average across all completions |
| Average max difficulty level | Mean highest difficulty completed | Average of each user's highest difficulty |
| Points earned | Total points for team | Sum of all points earned |
| Assigned content progress (%) | Percentage of assigned labs completed | Completed assigned labs ÷ total assigned |
| Number of users assigned | Users with assignments | Count of users with assigned content |
| Assigned content completed in period (%) | Labs completed during date range | Labs completed in period ÷ total assigned |
| Users progressed assigned content in period (%) | Users who completed at least one assigned lab | Users with progress ÷ users assigned content |
| Users completed all assignments (%) | Users who finished everything | Users done ÷ users assigned content |
| Never assigned (%) | Users never given assignments | Users with no assignments ever ÷ team |
| Number of assigned labs | Total labs assigned to team | Count of assigned labs |
When to use Team Overview
Use this dashboard to:
- Compare activity across teams
- Identify teams needing support
- See capability gaps at team level
- Monitor assignment progress by team
- Find high-performing teams
Team Comparison
Visualize team structure and engagement at a high level.
What's included
- Team management information
- Platform activity by team (proportion engaging)
- Assigned content status by team
- Assigned exercises (Crisis Sim, Workforce, Cyber Ranges if licensed)
Available filters
- Team name
- License type
- Date range
- Has current license (Y/N)
Key data points
| Metric | What it shows | How it's calculated |
|---|---|---|
| Number of teams without a team manager | Teams missing admins | Count of teams with no Team Admin |
| Users to be assigned a team | Users not in any team | Count of unassigned users |
| Average number of users per team manager | Users each admin manages | Total users ÷ total Team Admins |
| Platform activity | Percentage split by completion status | Comparison across teams |
| Assigned exercises | Percentage split by status | Comparison of assignment progress |
| Crisis Sim completions | Percentage completed | Completed ÷ assigned |
| Users connected to Cyber Range Exercise | Users who entered Cyber Ranges environment | Count of users who connected |
| Cyber Ranges flags captured | Correct flags entered | Correct tokens ÷ total flags |
| Cyber Ranges minutes connected | Total time in Cyber Ranges | Sum of all user time in exercise |
When to use Team Comparison
Use this dashboard to:
- Check team structure (everyone assigned?)
- Monitor team admin allocation
- Compare engagement across teams
- Identify teams needing more support
- Track exercise completion patterns
Individual
Drill into specific user activity and progress.
What's included
- Lab activity data
- Lab accuracy
- Content coverage by category
- Lab recommendations
- Progress (collections, career paths, assigned content, in-progress labs)
Available filters
- Manager assigned (Y/N)
- Date range
Key data points
| Metric | What it shows | How it's calculated |
|---|---|---|
| Labs completed | Total labs user finished | Count of completions |
| Badges earned | Collections completed | Count of collection badges |
| Cyber Ranges participated in | Cyber ranges user engaged with | Count of participations |
| Lab accuracy | User's accuracy vs org average | List of 10 labs with largest variance |
| Category coverage | Where user focuses effort | Content coverage + proficiency level |
| Lab recommendations | Suggested next labs | Based on completed labs (adjacent content) |
| Assigned content progress | Status of assigned collections | Completion percentage + time variance |
| Career path progress | Progress on career paths | Status + time spent |
| Collection progress | Progress on collections | Status + time spent |
| Labs in progress | Started but not finished | List with time spent + last visited |
Note on proficiency: Proficiency level is based on the highest difficulty collection completed in each category.
Note on time variance: If a user takes longer than the organization average for a collection, variance will be positive.
When to use Individual
Use this dashboard to:
- Spot talent in your organization
- Identify users needing support
- Support personal development reviews
- Track specific user progress
- See individual learning patterns
Common workflows
Weekly engagement check
- Start with Overview – Get the big picture
- Go to Platform Usage – Check inactive users
- Jump to Individual – Follow up with specific users
Team performance review
- Use Team Overview – Compare teams
- Switch to Team Comparison – Visualize proportions
- Drill into Individual – Check top and bottom performers
Assignment monitoring
- Open Assigned Activity – See overall progress
- Check Team Overview – Compare team progress
- Review Individual – Follow up on overdue users
Capability assessment
- Review Team Overview – Check Cyber Capability Scores
- Use Individual – See category coverage
- Compare to Assigned Activity – Track skill gap progress
Tips for using Platform Activity reports
Use filters wisely
Filters apply across most tabs. Set them once:
- Team name – Focus on specific teams
- License type – Separate by product
- Date range – Compare time periods
- Has current license – Include or exclude former users
Compare time periods
Many metrics show current vs previous period. This helps you spot trends:
- Is engagement increasing or decreasing?
- Are more users completing content?
- Is assignment progress improving?
Export for deeper analysis
You can export most tables to CSV. Use this to:
- Create custom pivot tables
- Build executive reports
- Track trends over time
- Share with stakeholders
Set up regular reviews
Schedule time to check:
- Weekly – Platform Usage for inactive users
- Monthly – Team Overview for team comparison
- Quarterly – Overview for high-level reporting
Combine with Data Explorer
Platform Activity shows aggregated dashboards. When you need raw data:
- Use Data Explorer for detailed CSV exports
- Cross-reference individual users
- Build custom analysis
Understanding calculations
Active vs logged in
- Logged in – User accessed the platform
- Active – User logged in during the date range
- Inactive – User hasn't logged in for 30+ days
Assigned content
Content can be assigned by:
- Managers – To whole organization, teams, or individuals
- Users themselves – As bookmarks/favorites via Upskill or Exercise menus
Working hours
The platform defines working hours as:
- 9am-5pm in the user's timezone
- Used for in-hours vs out-of-hours calculations
Median vs mean
Some metrics use median (middle value), others use mean (average):
- Median – Less affected by outliers (e.g., average completions per user)
- Mean – True average (e.g., average accuracy)
Time in labs
"Active time" means:
- Lab is open in browser
- User is interacting with content
- Estimated when actual time unavailable
Next steps
- Export to CSV for custom analysis
- Check Data Explorer for raw data exports
- See Capability by Area Reports for skill gap analysis
- Review Metrics Tracker for benchmark comparisons